Elevate your manufacturing strategy with key resources
Download our Technological Maturity Self-Assessment & Strategic Vision Exercise tools to assess your software ecosystem profile and to plan for future growth.

In this article, we explore a detailed case study of a fictional company aiming to enhance its cost control management. Learn how to evaluate whether financial objectives and expense tracking are met using effective dashboard tools. Discover strategies to optimize budget monitoring, analyze cashflow, and track key performance indicators (KPIs). This comprehensive guide offers valuable insights for businesses seeking to improve their financial reporting and achieve their budgetary goals.
Budget monitoring is a priority for any company that wants to ensure smooth operations. For ongoing tracking, or even periodic check-ins, financial managers need to have the company’s complete financial information in hand to do in-depth analysis and make decisions accordingly. But in reality, do these managers actually have access to this kind of data?
The truth is, sometimes these people only have an approximate idea of the company’s costs and revenue, which leads to approximate decision-making based on an unreliable financial performance analysis.
So how can you avoid this? By using a cost monitoring dashboard.
Having good visibility on your key performance indicators (KPI) allows you to make informed decisions to improve production processes, reduce costs and satisfy customers. In addition, a good understanding of these indicators can help you anticipate market trends and develop strategies to maintain and increase your company’s competitiveness.
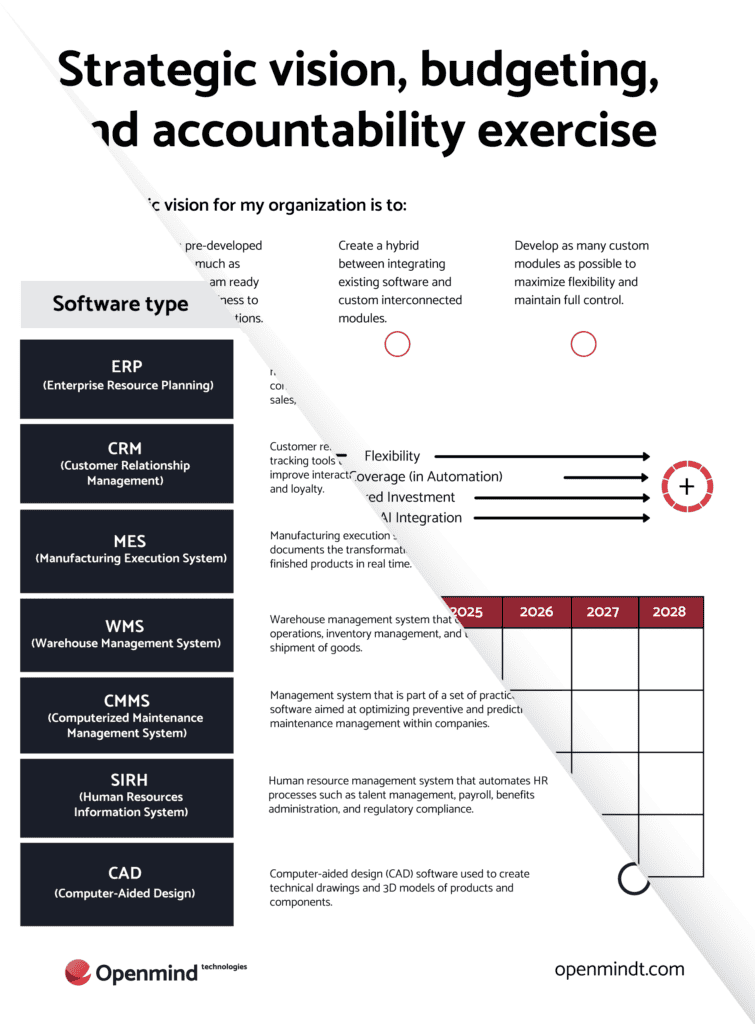
Download our Technological Maturity Self-Assessment & Strategic Vision Exercise tools to assess your software ecosystem profile and to plan for future growth.
The cost monitoring dashboard is a strategic tool that helps define and evaluate a company’s financial success.
With this type of dashboard, the company’s management team has all the information they need to put strategies in place: using factual information—both quantifiable and justifiable—to make smarter strategic decisions.
To more effectively track financial health and achievement of objectives, the company has a tool for easily comparing budget forecasts and objectives in real time. This information can help identify variances and what is causing them, so the company can adapt its strategy to match reality.
The company followed the steps below to develop the dashboard.
The primary purpose of a cost monitoring dashboard is to effectively manage cashflow.
This means:
The cost monitoring dashboard should enable the company to answer the following questions:
The dashboard serves to help the company meet and exceed its financial objectives by optimizing costs and expenses.
All useful data for the project is stored in a database, which was created previously by the team using data modelling from the different data warehouses.
The dashboard has two main sections:
The first sums up the company’s profits and losses
The second covers the variances between costs and the company’s objectives
For easier reading and navigation, the cost dashboard is separated into two sections over two pages. The important KPIs appear in a prominent location at the top of the page, and then tables and graphs are presented, pictured below.
The company chose to invest in a custom program to make sure the software really fit their needs. They also chose to hire an external team to manage their IT infrastructure, which allows them to focus 100% on their primary concerns.
Page 1: Profits and losses

This section identifies different optimization methods for increasing earnings: whether by increasing revenue, lowering costs, or both.
Page 2: Revenue and cost variance

This part of the dashboard makes it easy to see variances and their causes, so that the various levels of management can evaluate them and directly discuss what needs to be done to address the issues.
The leadership quickly found the important information in the dashboard to get them talking about the company’s strategic future:
In the end, all of these questions came from data in the cost monitoring dashboard, and clearly gave the company a good overall picture so they can make decisions that will boost the company’s growth. Business intelligence tools are the keys to operational efficiency and accuracy.
For more insights on the benefits of using dashboards in manufacturing, check out our article on the 8 Advantages of Having a Dashboard for a Manufacturing Company.
Subscribe to receive our exclusive updates directly to your email.

Claude Cowork: Demystifying the Productivity Tool Everyone’s Talking About
Discover Claude Cowork, the AI agent everyone's talking about. See how Openmind's team uses it daily to work smarter, automate tasks, and get more done. Real use cases, no jargon — free workshop.

Mill Test Processing From Administrative Overhead to Intelligent Automation
Discover how digital automation and AI can streamline Mill Test (MTR) processing, reduce administrative burden, and improve reliability across the steel industry. Join this practical webinar.

AI Workflow vs AI Agent: Understand the Difference Before Automating
Learn when to use an AI-enhanced workflow or an AI agent, how they differ, and which approach fits your operations. Includes an AI task prioritization grid.

ALL IN (AI) 2025: 8 Strategic Actions to Secure Your Competitive Advantage
Discover 8 key AI strategies from ALL IN 2025 to boost productivity, secure data, and gain a sustainable competitive edge.
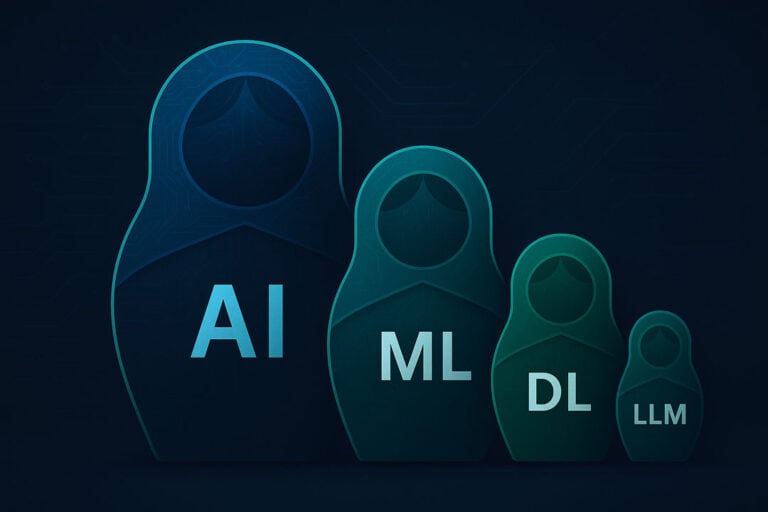
AI vs LLM: What’s the Difference, and How Do They Work?
Understand how LLMs work, why they’re called digital brains, and how to use them to automate real business tasks with natural language.
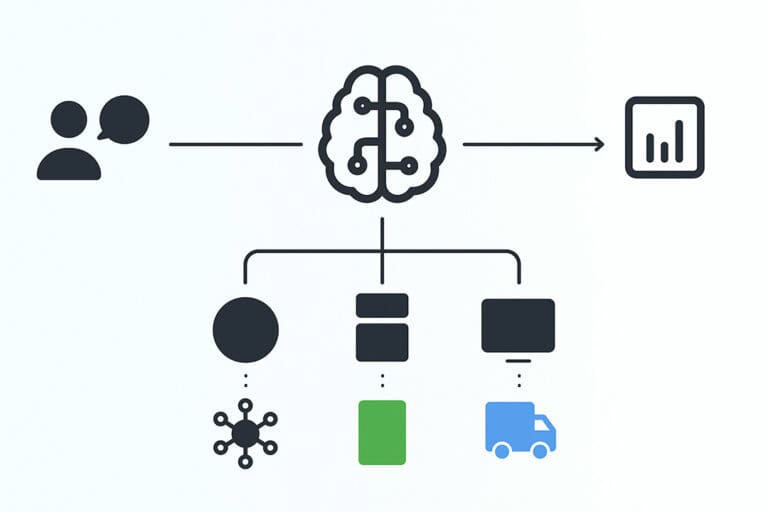
What is an AI Agent? The Difference Between Manual & Automated Workflow
What is an AI Agent? Learn how it compares to manual and automated workflows, and why it matters for your business operations.

Automate the Management of Your Mill Test Reports, From Reception to Anonymization.
Speed up your Mill Test Reports workflow with AI. Upload, analyze, anonymize — all in minutes. No clicks, no errors, just output.

AI Cohort: 5 Days to Move From Theory to Impact in Business
Demystify AI and turn it into a concrete lever for your business. A guided, accessible and jargon-free course.

How Change Management Accelerates AI Adoption in Businesses
Learn how structured change management accelerates AI adoption, boosts team engagement, and secures long-term business transformation.
Tell us more about your needs so that we can better route your project to our specific SWAT team.
1
During the brainstorming phase, we work with you to identify potential solutions to your business challenges to generate the technology response that aligns with your business objectives.
2
Through our requirements gathering process, we work closely with you to define and prioritize your needs, ensuring that our solutions are tailored to meet your specific requirements.
3
This phase marks the beginning of our partnership. We’ll finalize the project plan and establish clear communication channels to ensure a smooth and successful project execution.