Elevate your manufacturing strategy with key resources
Download our Technological Maturity Self-Assessment & Strategic Vision Exercise tools to assess your software ecosystem profile and to plan for future growth.

In this article, we will look at a manufacturing company that wants to improve its production tracking and optimize its performance and efficiency at its various production sites. To achieve this, the company is implementing a manufacturing operational dashboard to enhance its production management.
The context
To ensure efficiency, the modern manufacturing company needs to continuously track its production, and this tracking requires access to production data in real time. Wisely, the company decides to go with an automated tool, since there is a lot of data to be processed, and the results need to be up to date at all times. For this purpose, the company therefore plans to create an operational production dashboard in order to track key production indicators continuously, and in real time.
An operational dashboard enables users to evaluate all production data in real time, while more easily analyzing the different production-related key performance indicators. Of course, synthesizing overall production results involves tracking production volume, machinery output, resources, and product quality, etc.
Having good visibility on your key performance indicators (KPI) allows you to make informed decisions to improve production processes, reduce costs and satisfy customers. In addition, a good understanding of these indicators can help you anticipate market trends and develop strategies to maintain and increase your company’s competitiveness.
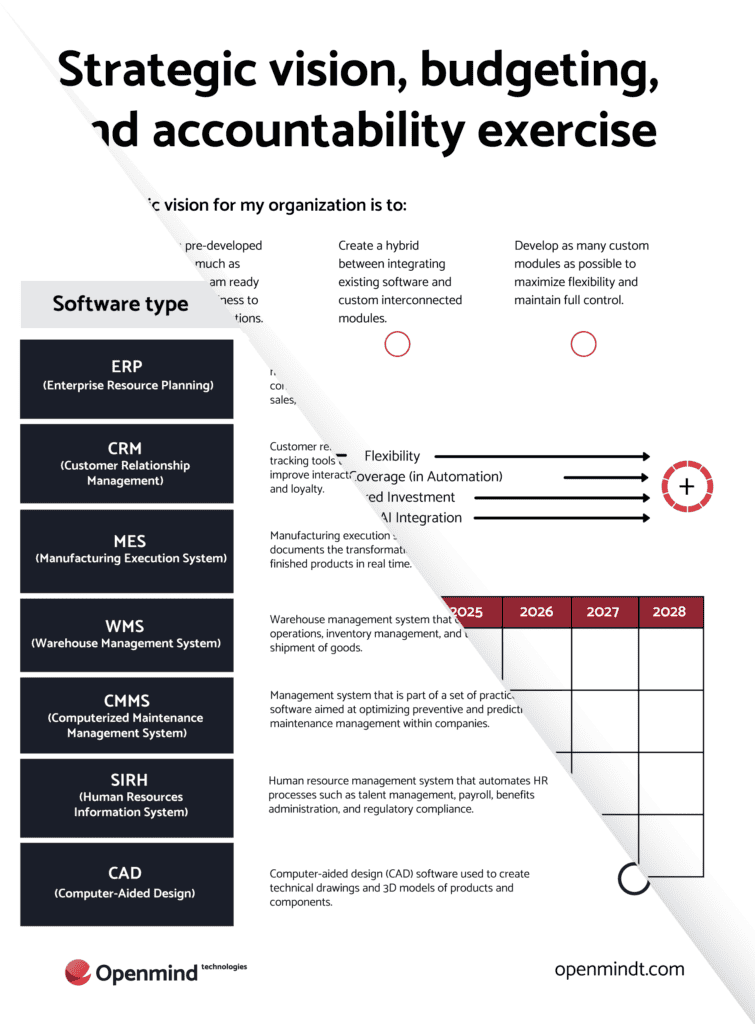
Download our Technological Maturity Self-Assessment & Strategic Vision Exercise tools to assess your software ecosystem profile and to plan for future growth.
As explained in our previous guide to implementing a dashboard, there are different steps necessary when designing this type of tool, summarized as follows:
Objectives
The primary objective is to ensure better tracking of operational performance using a manufacturing operations dashboard to optimize production and increase revenue. This tool provides a real-time snapshot of productivity at various levels within the company, helping the operational team identify and anticipate potential problems, while optimizing performance and production efficiency.
KPIs
To accurately quantify the company’s productivity, selecting the right key performance indicators (KPIs) is crucial. These KPIs provide the most quantitative data possible, enabling the production team to have a comprehensive productivity overview across all production sites and teams, and compare outcomes with initial objectives.
Here is a quick list of the KPIs selected:
Data aggregation and processing
Embracing digital transformation, the company has automated its operational data extraction, storing the data in a data warehouse, either internally or in the cloud. This ensures up-to-date, comprehensive data for designing the manufacturing operations dashboard, which provides real-time manufacturing analytics.
Which information will be presented
Taking advantage of a digital transformation that is well on its way, the company has already automated its operational data extraction, and the data is stored in a data warehouse, internally, or in the cloud. The company therefore has up-to-date, comprehensive data to begin designing its operational dashboard.
The company decided that the dashboard would highlight the following elements:
Formatting and viewing
To make the data easier to read and interpret, the dashboard is divided into two pages covering each of the elements listed above. Additionally, several filters are available for users to analyze the results in detail, enhancing the visualization of manufacturing data and supporting data-driven manufacturing decisions.
Choosing the tool
The company chose Microsoft’s Power BI for the dashboard because it has a variety of features and considerable advantages compared to other programs:
Presenting the results
After going through several steps, here is the dashboard that the team will use on a daily basis. As we emphasized above, it will contain two sections that cover the main focus points that the production management team are interested in: results by sector and resources.
Here, we’ll look at the pages, and the major information they contain.
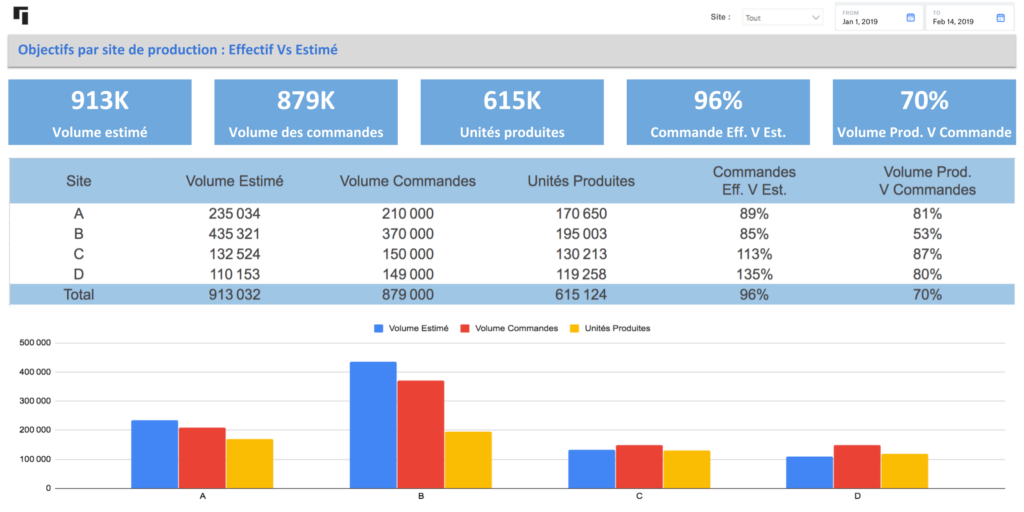
Page 1: Productivity by sector and evaluation of objectives
The dashboard’s first page present information about the company’s operational objectives, and uses a tool to track the company’s ongoing orders.
This part presents the productivity comparison for the company’s different production sites. It shows the various KPIs related to production volumes compared to estimations, and the results are presented as a table and graph for easy interpretation.
Note that users can filter by production site and select the period they are interested in.
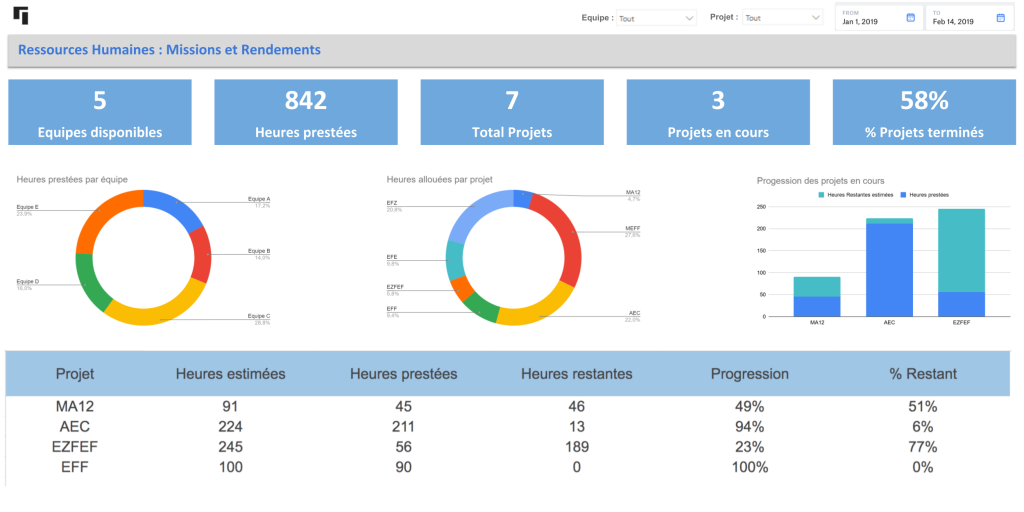
Page 2: Team productivity
The second part of the dashboard has an overview of the performance of the company’s human capital. In this part, users can view the productivity from the company’s various teams. The idea is to get a specific picture of the missions the operational team is working on, in order to identify which areas could be optimized to boost productivity.
Whether to ensure productivity from your company’s various sectors or individuals, an operational dashboard is certainly a valuable tool.
Its advantages include interactivity, enabling more in-depth analysis; precise, real-time information; saved time; etc.
User-friendly, and visually easy to understand, it gives company leaders a quick picture of the company’s current situation and empowers them to make the right decisions.
For more insights on the benefits of using dashboards in manufacturing, check out our article on the 8 Advantages of Having a Dashboard for a Manufacturing Company.
Subscribe to receive our exclusive updates directly to your email.


Claude Cowork: Demystifying the Productivity Tool Everyone’s Talking About
Discover Claude Cowork, the AI agent everyone's talking about. See how Openmind's team uses it daily to work smarter, automate tasks, and get more done. Real use cases, no jargon — free workshop.

Mill Test Processing From Administrative Overhead to Intelligent Automation
Discover how digital automation and AI can streamline Mill Test (MTR) processing, reduce administrative burden, and improve reliability across the steel industry. Join this practical webinar.

AI Workflow vs AI Agent: Understand the Difference Before Automating
Learn when to use an AI-enhanced workflow or an AI agent, how they differ, and which approach fits your operations. Includes an AI task prioritization grid.

ALL IN (AI) 2025: 8 Strategic Actions to Secure Your Competitive Advantage
Discover 8 key AI strategies from ALL IN 2025 to boost productivity, secure data, and gain a sustainable competitive edge.

AI vs LLM: What’s the Difference, and How Do They Work?
Understand how LLMs work, why they’re called digital brains, and how to use them to automate real business tasks with natural language.
What is an AI Agent? The Difference Between Manual & Automated Workflow
What is an AI Agent? Learn how it compares to manual and automated workflows, and why it matters for your business operations.

Automate the Management of Your Mill Test Reports, From Reception to Anonymization.
Speed up your Mill Test Reports workflow with AI. Upload, analyze, anonymize — all in minutes. No clicks, no errors, just output.

AI Cohort: 5 Days to Move From Theory to Impact in Business
Demystify AI and turn it into a concrete lever for your business. A guided, accessible and jargon-free course.

How Change Management Accelerates AI Adoption in Businesses
Learn how structured change management accelerates AI adoption, boosts team engagement, and secures long-term business transformation.
Tell us more about your needs so that we can better route your project to our specific SWAT team.
1
During the brainstorming phase, we work with you to identify potential solutions to your business challenges to generate the technology response that aligns with your business objectives.
2
Through our requirements gathering process, we work closely with you to define and prioritize your needs, ensuring that our solutions are tailored to meet your specific requirements.
3
This phase marks the beginning of our partnership. We’ll finalize the project plan and establish clear communication channels to ensure a smooth and successful project execution.